
Assignment 12
Mathematics Problems and Explorations using Spreadsheets
Nicolina Scarpelli
The spreadsheet is a utility tool that can be adapted to many different explorations, presentations, and simulations in mathematics. Spreadsheets save valuable time by allowing teachers and students to complete essential calculations quickly. They save time not only by making initial calculations faster, but their automatic recalculation features also make it easy to update products such as grades. Entries also can be changed, added, or deleted easily, with formulas that automatically recalculate the final result. In this assignment, I used Microsoft Excel to make graphs of functions and make charts from calculated data.
Investigation 1:
Spreadsheets help people visualize the impact of changes in numbers. Since values are automatically recalculated when changes are made in a worksheet, a student can change the numbers or entries and immediately see the new result. I believe implementing spreadsheets into secondary education makes working with numbers more fun and easier to understand difficult concepts. Spreadsheets can make concepts more graphic which will enable students to visually see how graphs are changing. For my first investigation, I constructed a graph of a function y = f(x) by generating a table of values with the x values in one column and the y values in another.
I began by graphing the function y = 4x + 7. Look at the steps below to see how a spreadsheet was created for the function.
Steps to construct the graph of the function y = 4x + 7:
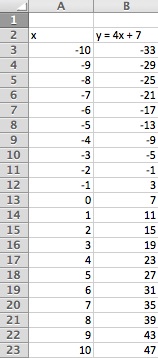
(1) Begin by labeling a column x, and a column y = 4x + 7.
(2) Underneath your column x, beginning typing in whatever values you want your function to range from. I have ranged my values from -10 to 10 for this example. In order to do this quickly, type in your first value in A3 then your next value in A4. Highlight both of the values, and then in the bottom right hand corner click on the little box that shows up, and drag it down however many spaces you would like. This will automatically calculate the values for you.
(3) Underneath your column y, begin by typing in whatever your function is equal to. You must use an equals sign in order for the program to know you want a value calculated. For example, in B3 I typed " = 4*A3 + 7" to calculate my y-value for an x value equal to -10. You can also highlight this space and click on the the little box in the right hand corner and drag it down. This will calculate your y-values automatically. Observe my data set below.
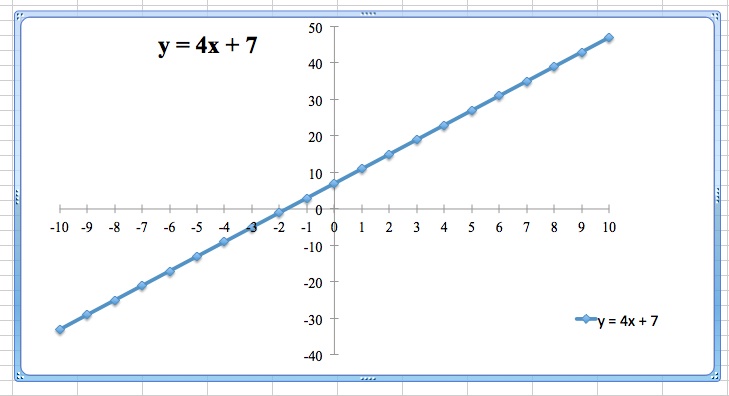
(4) Then, to graph your equation, highlight all of your data and go up to insert chart. You can choose your chart and it will plot your values instantly. For this example, I chose a "marked line" chart. This is the graph it created below. Once you have a chart of your data created, you can change the font, the scale, and many more features.
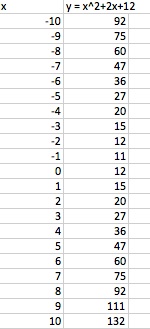
Next, let's graph a quadratic function using the same steps I took above to graph a linear function. Plot all of your data just like before, and then go to the "insert" drop down menu and click chart. Observe my data and chart created below for the quadratic function y = x2 + 2x + 12.
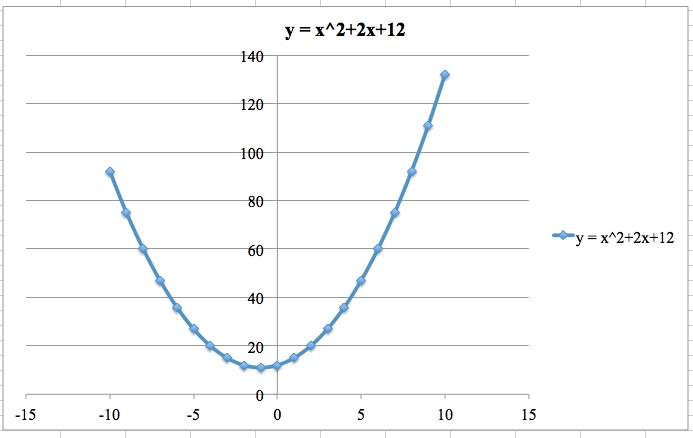
In this example, I also used the chart "marked line". It created a parabola which we know is correct because the graph of a quadratic function is always a parabola.
Click here for the Microsoft Excel that contains these two data sets.
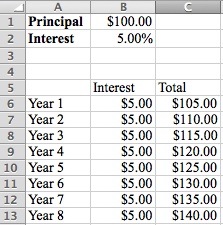
Now, for the second investigation, let's explore problems of growth, meaning savings or compounded interest problems. I began this investigation by exploring the concept of simple interest. Simple interest is called simple because it ignores the effects of compounding, meaning the interest charge is always based on the original principal, so interest on interest is not included. We can use the formula for simple interest to quickly calculate the interest change on a short-term loan. Simple interest is determined by multiplying the interest rate by the principal by the number of periods.
Simple Interest Formula = P x I x N
Where: P is the principal amount, I is the interest rate, and N is the duration of the loan using number of periods.
Observe the data I entered in by hand below.
To calculate the simple interest in an Excel workbook, begin by clicking on the cell you want to type the formula into.
Begin by typing: " = fv " and a formula will pop up that looks like this = fv(rate,nper,pmt, [pv], [type]) where:
rate = rate
n-periods = how many years, months, etc.
pmt = payment = interest * principal
[pv] = present value
type = do not put anything here since we are using simple interest
Since we are working with simple interest, there is no rate because it does not increase at all, thus our rate is equal to 0. For this example our n-period is equal to 8 years. If you are not using years, say you're using months or quarters that would be your number of periods just make sure to adjust the interest and payment for that period. Our payment is 5% of the principal so it's $5.00 every year. To get your payment amount you have to multiply the interest amount by the principal amount. The present value is the principal or original amount that you first invested, for this problem it is $100.00.
So our formula would be fv = (0,8,5,100) and when you press enter you will get $140.00 which is the same amount that we got after 8 years when we calculated each year individually.
To view the changes graphically, insert a chart(I used a marked line chart) and a chart like this will appear.
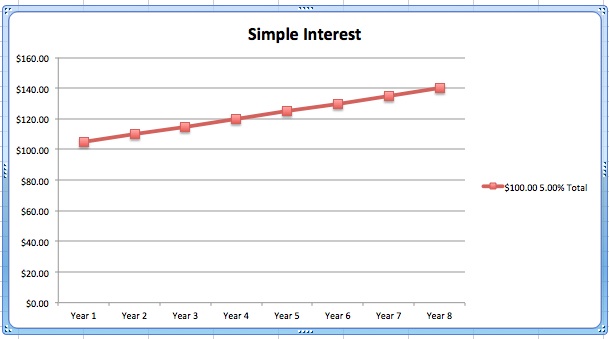
Click here for the Microsoft Excel document that calculates simple interest.
Finally, let's move to an example of compounded interest. Compound interest is interest that is paid on both the principal and also on any interest from past years. It's often used when someone reinvests any interest they gained back into the original investment. For example, if I received a 15% interest on my $1,000 investment, the first year and I reinvested the money back into the original investment, then in the second year, I would get 15% interest on $1,000 and the $150 I reinvested. Over time, compound interest will make much more money than simple interest. The formula used to calculate compound interest is: Pn = pv*(1+r)^n where
Pn = value at the end of so many periods
pv = present value or beginning value
r = interest rate (constant in this case)
n = number of periods
Observe the data below from a spreadsheet I constructed using Excel.
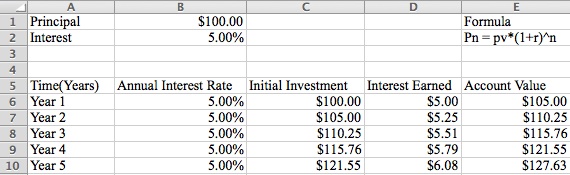
For this case, we have Pn = 100*(1+.05)^5
If you type = 100*(1+.05)^5 into a column and press enter, it will give the answer $127.63 which is what we calculated above.
So let's use my example above and say we put an initial amount of $100.00 in our bank account. After year 1 with 5% interest, we will have $105.00. Now, with compound interest, $105.00 is our new beginning amount for year 2. We must multiply (105)(0.05) to get our interest payment. Thus, our total will be 105 + (105)(.05) = 105 + 5.25 = 110.25 dollars. For the third year, our beginning amount will be $110.25 with an interest rate of 5%. Thus, our total after year 3 will be $110.25 + (110.25)(.05) = $110.25 + $5.51 = $115.76.
Here we display a graph of the data for the spreadsheet above.
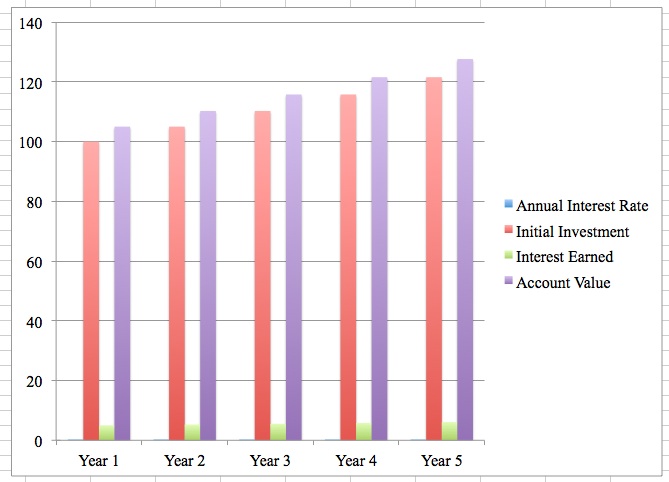
Click here for the Compound Interest Excel document.
Now, if we had a bank account with compound interest and we had a bank account with simple interest, the compounded interest bank account will eventually make more money. Take our example with the principal amount of $100, an interest of 5%, and have the money in the each account for 8 years.
The amount of money you'll have after 8 years in the bank account with compounded interest will be: Compound Interest = 100*(1 + 0.05)^8 = $147.75
The amount of money you'll have after 8 years in the bank account with simple interest will be:
Simple Interest = 100 + (100*0.05*8) = $140.00
Thus, you earned $7.75 more in the bank account with compounded interest. You make think this is just a little amount of difference, but let's try it with larger values so you can really visualize the change.
Let's say we start with an investment of $15,000. The money is deposited into an account which yields a 6.5% annual return. How much money will you have after 10 years if it is in a bank account with compounded interest? How much money will you have after 20 years if it is in a bank account with compounded interest?
Amount of money after 10 years = (15000)*(1+0.065)^10 = $28,157.06. Thus, your initial amount of $15,000 has almost doubled after 10 years in a bank account with compounded interest. After twenty years, you'll have $52,854.68.
How much money would you have if it was in a bank account with simple interest? After ten years, you'd have (15,000) + (15000*0.065*10) which is only $24,750. How about after twenty years? You'd have a total amount of $34,500. Thus, as you can see, you will earn more money in the long run if you invest your money in a compounded interest bank account.
Return to Homepage